Dementia & Early Diagnosis of Alzheimer's
What is Dementia?
Dementia is not a single disease, but a term used to describe a wide range of conditions, including Alzheimer’s disease. Dementia is caused by abnormal brain changes that affect cognitive abilities and can impact one’s feelings, behavior and relationships.
Alzheimer’s disease is the most common cause of dementia, a disease that robs millions of people each year of critical thinking capabilities required for a healthy and happy lifestyle. The impact of Alzheimer’s is staggering.1
Early diagnosis of the cause of cognitive impairment can help a patient begin treatment or therapy that can provide a longer period of healthier mental function.

6th leading cause
More than 5M

1 in 3 seniors

Alzheimer’s kills
10 Early Signs and Symptoms of Alzheimer’s Disease
One of the most common signs of Alzheimer’s disease, especially in the early stage, is forgetting recently learned information. Others include forgetting important dates or events, asking the same question over and over again, or increasingly needing to rely on memory aids (e.g., reminder notes or electronic devices) or family members for things the person used to handle on their own.
What’s a typical age-related change? Sometimes forgetting names or appointments, but remembering them later.
Some people living with dementia may experience changes in their ability to develop and follow a plan or work with numbers. They may have trouble following a familiar recipe or keeping track of monthly bills. They may have difficulty concentrating and take much longer to do things than they did before.
What’s a typical age-related change? Making occasional errors when managing finances or household bills.
People living with Alzheimer’s disease often find it hard to complete routine tasks. Sometimes they may have trouble driving to a familiar location, organizing a grocery list or remembering the rules of a favorite game.
What’s a typical age-related change? Occasionally needing help to use microwave settings or to record a TV show.
People living with Alzheimer’s can lose track of dates, seasons and the passage of time. They may have trouble understanding something if it is not happening immediately. Sometimes they may forget where they are or how they got there.
What’s a typical age-related change? Getting confused about the day of the week, but figuring it out later.
For some people, vision problems are a sign of Alzheimer’s. They may also have problems judging distance and determining color or contrast, causing issues with driving.
What’s a typical age-related change? Vision changes related to cataracts.
People living with Alzheimer’s may have trouble following or joining a conversation. They may stop in the middle of a conversation and have no idea how to continue, or repeat themselves. They may struggle with vocabulary, have trouble naming a familiar object or use the wrong name.
What’s a typical age-related change? Sometimes having trouble finding the right word.
A person living with Alzheimer’s may put things in unusual places. They may lose things and be unable to go back over their steps to find them again. He or she may accuse others of stealing, especially as the disease progresses.
What’s a typical age-related change? Misplacing things from time to time and retracing steps to find them.
Individuals may experience changes in judgment or decision-making. For example, they may use poor judgment when dealing with money, or pay less attention to grooming or keeping themselves clean.
What’s a typical age-related change? Making a bad decision once in a while, like neglecting to change the oil in the car.
A person living with Alzheimer’s may experience changes in the ability to hold or follow a conversation. As a result, he or she may withdraw from hobbies, social activities or other engagements. They may have trouble keeping up with a favorite team or activity.
What’s a typical age-related change? Sometimes feeling uninterested in family or social obligations.
Individuals living with Alzheimer’s may experience mood and personality changes. They may be easily upset at home, at work, with friends or when out of their comfort zone.
What’s a typical age-related change? Developing very specific ways of doing things and becoming irritable when a routine is disrupted.

Advanced Imaging Solutions
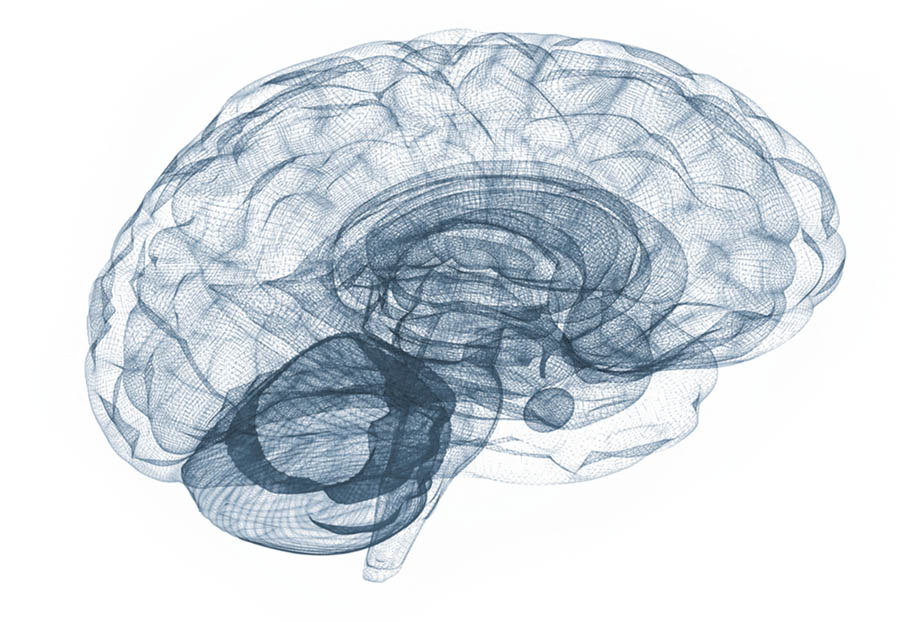
Alzheimer’s disease is caused by shrinkage (atrophy) in a region of the brain called the hippocampus, which helps regulate emotions, manages long-term memory, and also plays a vital role in a person’s spatial navigation abilities. One specialized technique that uses Magnetic Resonance Imaging (MRI) is called 3-D volumetric quantitative analysis. At HALO Precision Diagnostics™, we use Icobrain DM from Icometrix to quantify clinically relevant brain structures in individual patients with neurological disorders, such dementia, and Icobrain MS for multiple sclerosis plaque quantification as well as for other white matter diseases. We provide physicians with a report that provides a detailed volumetric report.
Icobrain DM - Evaluate Relevant Brain Structures in Dementia Patients
Sample Report Page 1: Lobular and hippocampal volume loss
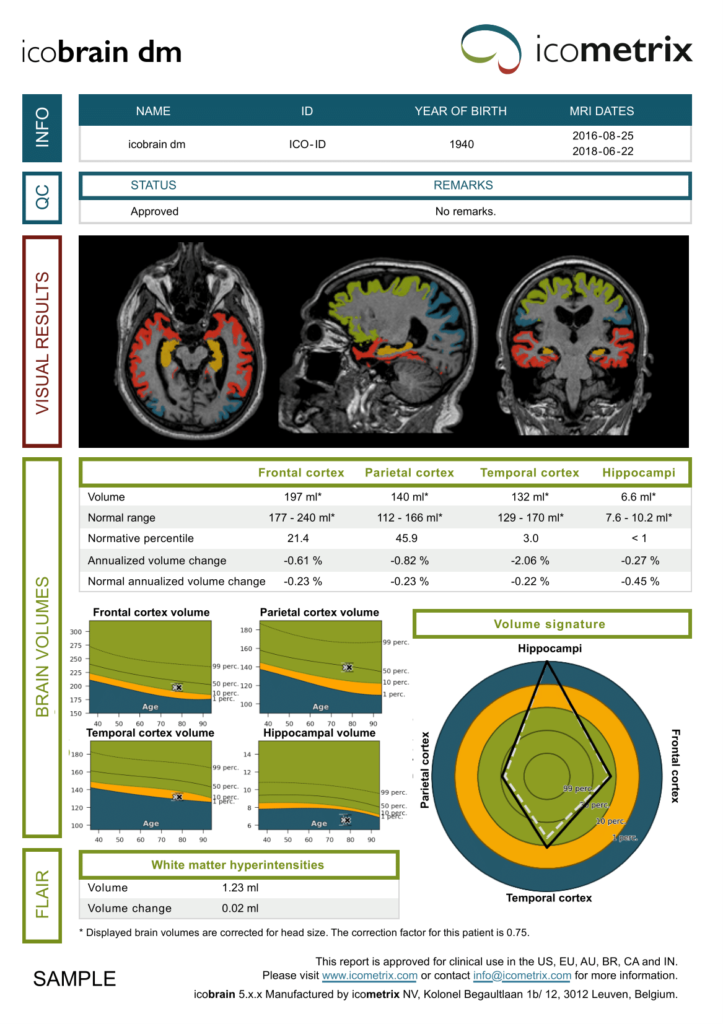
MRI dates = dates of the MRI scans on which the report is based. When only one MRI exam is available, a baseline report is created which reports volumes but no volume changes
Status of semi automated quality control (Approved / Approved with remarks / rejected) and remarks on the quality of the original images and the segmentation.
Color-coded segmentation of substructures
– Frontal cortex (green)
– Parietal cortex (blue)
– Temporal cortex (red)
– Hippocampi (orange)
This segmentation is also available in DICOM format.
Brain volumes are corrected for head size. The normal range and normative percentiles serve as a reference based on healthy controls. Annualized volume change describes the percentage of brain volume change per year compared to the previous scan. The normal annualized volume change represents the average expected annual volume change for a healthy age- and gender-matched person.
Population graphs show the age- and gender-matched average and normal ranges for each substructure. The current (black) and previous (white) time points are marked with an ‘x’. The error bars are computed from the pooled results of several test-retest experiments. They represent the interval in which the differences between test- and retest results can be found with 90% confidence.
Volume signature compares the normative percentile of the substructures and its change between the current (full black line) and previous (dashed white line) time point.
Flair white matter hyperintensities are reported when a FLAIR sequence is included. Volume change = total difference in volume compared to the previous scan.
The icobrain software version and its approval for clinical practice.
Sample Report Page 2: Global Brain Volume Loss
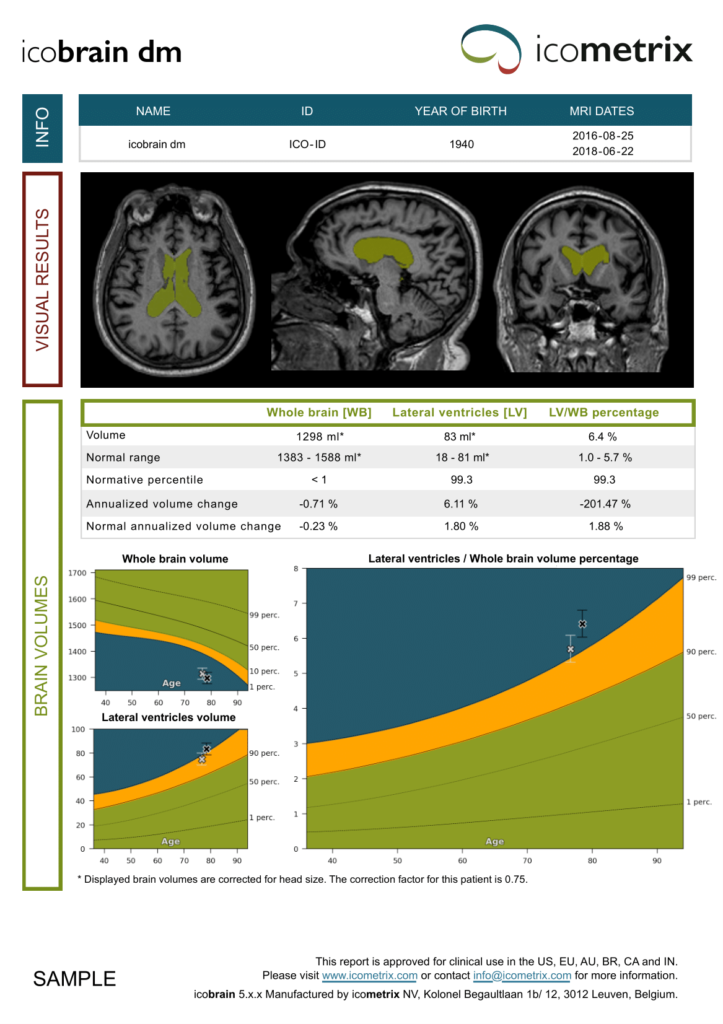
MRI dates = dates of the MRI scans on which the report is based. When only one MRI exam is available, a baseline report is created which reports volumes but no volume changes.
Lateral ventricles (green) segmentation are depicted in three planes. This segmentation is also available in DICOM format.
Whole brain and lateral ventricles volume are corrected for head size. The normal range and normative percentiles serve as a reference based on healthy controls. Annualized volume change describes the percentage of brain volume change per year compared to the previous scan. The normal annualized volume change represents the average expected annual volume change for a healthy age- and gender-matched person.
Flair white matter hyperintensities are reported when a FLAIR sequence is included. Volume change = total difference in volume compared to the previous scan.
The graph shows the age- and gender-matched average and normal range for the whole brain and lateral ventricles volume (left) and the ratio of the lateral ventricles over the whole brain percentage (right) of healthy people. The time point is marked with an ‘x’. The error bars are computed from the pooled results of several test-retest experiments. They represent the interval in which the differences between test- and retest results can be found with 90% confidence.
The icobrain software version and its approval for clinical practice
Functional Imaging in Dementia
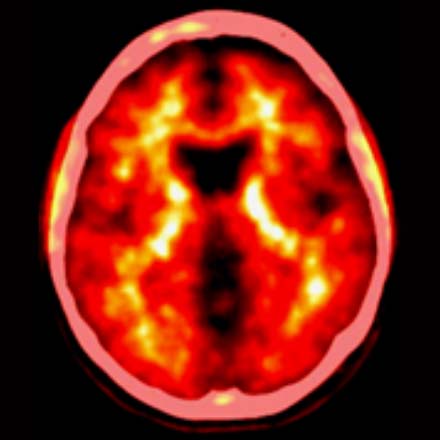
Another technique for pinpointing the cause of a cognitive dysfunction is functional imaging. This approach uses Positron Emission Tomography (PET) and Computed Tomography (CT) in combination to observe the brain’s function. Functional imaging is used by physicians to determine how well specific brain regions are using sugar or oxygen, which can help reveal the site and cause of memory or problem-solving ability deficits. PET/CT imaging also allows the physician to see what’s happening inside the brain at a molecular level, so they can identify or rule out cellular or chemical changes that indicate a specific disease.
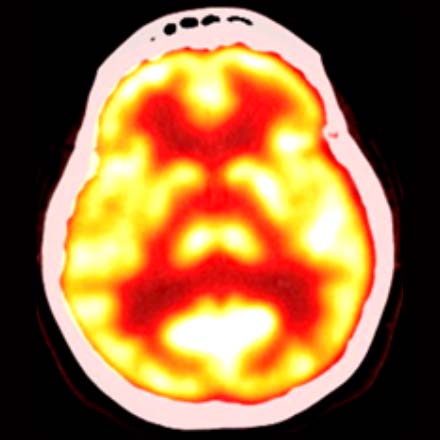
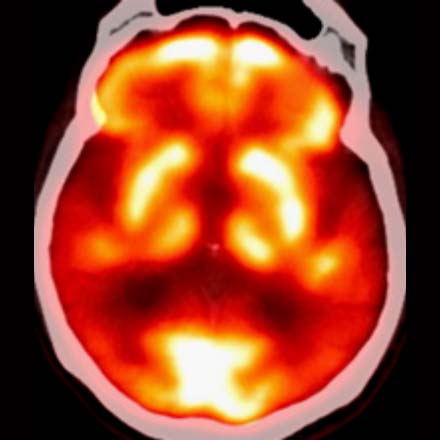
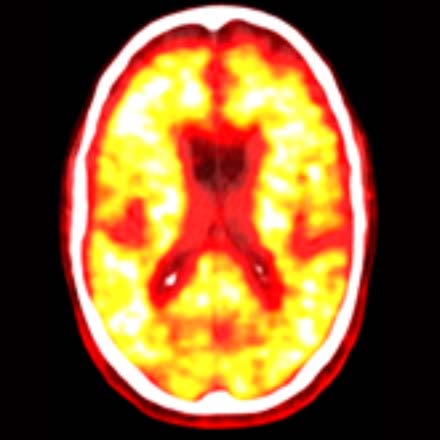
Individuals at Risk for Dementia Show Reduced Glucose Metabolism
Mild cognitive impairment (MCI) is an intermediate stage between normal cognitive decline and dementia. Radiopharmaceuticals like Fluorodeoxyglucose (18F) or fluorodeoxyglucose F 18 (FDG-18) are used, along with positron emission tomography (PET), to better understand the progression of MCI into dementia, including Alzheimer’s disease (AD). This approach can provide information about neuronal activity in the brain by measuring glucose metabolic rate; the progression of dementia is accompanied by a continued decrease in the uptake or metabolism of glucose.
Studies have also shown that FDG-PET has the potential to differentiate patients with AD and patients with other causes of dementia. This has been an important advancement in the evaluation of patients with MCI and a critical tool in quickly detecting progression into various forms of dementia.
Normal FDG-18
Alzheimer’s Disease
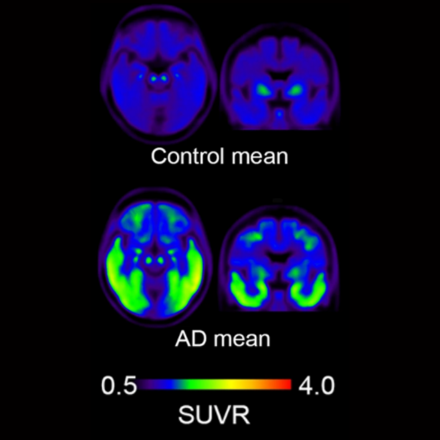
What is Beta Amyloid and What Role Does it Play in Dementia?
Although the cause of Alzheimer’s disease has not been fully established, evidence suggests that the amyloid-β or beta amyloid (Aβ) protein plays an important role. Accumulation of this protein or peptide in the form of amyloid plaques is a hallmark of dementia caused by Alzheimer’s. Aβ deposits are thought to occur before cognitive symptoms in Alzheimer’s disease and are therefore a potential marker of the disease. Amyloid imaging agents, like Amyvid™ (Eli Lilly), bind to Aβ deposits and allow physicians to see amyloid plaque in the brain when paired with PET-CT imaging.
Amyloid Negative
Amyloid Positive
What is a Tau Tangle?
TAUVID™ from Eli Lilly was approved by the FDA for positron emission tomography (PET) imaging of the brain to estimate the density and distribution of aggregated tau neurofibrillary tangles (NFT). NFTs are aggregates or clusters of a protein called tau – a widely accepted primary marker of Alzheimer’s disease that can become “tangled”. The tau protein in the brains of people with AD are abnormally shaped and cannot serve their normal function of assisting in the transport of nutrients and other important substances from one part of a nerve cell to another.
ADDITIONAL EDUCATIONAL RESOURCES
Schedule a Consultation
Submit this form and we will contact you, usually within 24 hours, to answer your questions.